The shape of the AD curve
The real balance effect
The real balance effect provides two interesting insights into the slope of the AD curve.
- Firstly, it suggested that, because the supply of money needed to buy real output in the economy is fixed in the short run, a rise in the price level (say P to P2), means that the existing quantity of money in circulation cannot purchase as much output as at the old price level, so ‘real’ expenditure falls, from Y to Y2. Hence the AD curve slopes downwards.
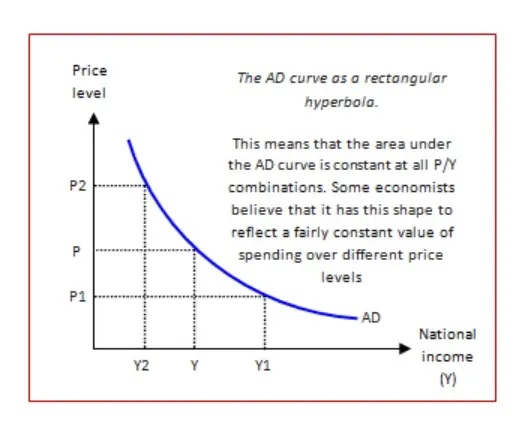
- The second implication of this is that the total amount spent in the economy by households, firms and the government, must, in the short run, remain constant, so P x Y will be constant at all price levels. Hence, the slope of the AD curve is a rectangular hyperbola.
The slope of the AD curve in a recession
However, there is a long running debate in economics about the slope of the AD curve. Many economists, including Paul Krugman, argue that the real balance effect may be small during a recession, and that the AD curve may become vertical. This relates to the situation of the ‘liquidity trap’ discussed by Keynes in the 1930s. In basic terms, in a recession interest rates will fall towards zero, and at or near zero changes in the money supply will have little if no effect on AD, and hence output.
This has a recent debate about the wisdom of pumping more money into the economy as a quick solution to the ‘credit crisis’.