Photo by Fabian Blank / Unsplash
Break-Even Analysis and Equation
Break-Even Analysis
Break-even analysis is a numeric technique in which break-even point is used for making businesses decisions. This quantitative technique is used to make decisions related to production, sales, location and product launch.
Break-Even Point
Break-even point is the number of units of output for which total revenue becomes equal to the total cost and there is no profit or loss. For breakeven output, total revenue covers all the fixed and variable costs.
Break-Even Equation
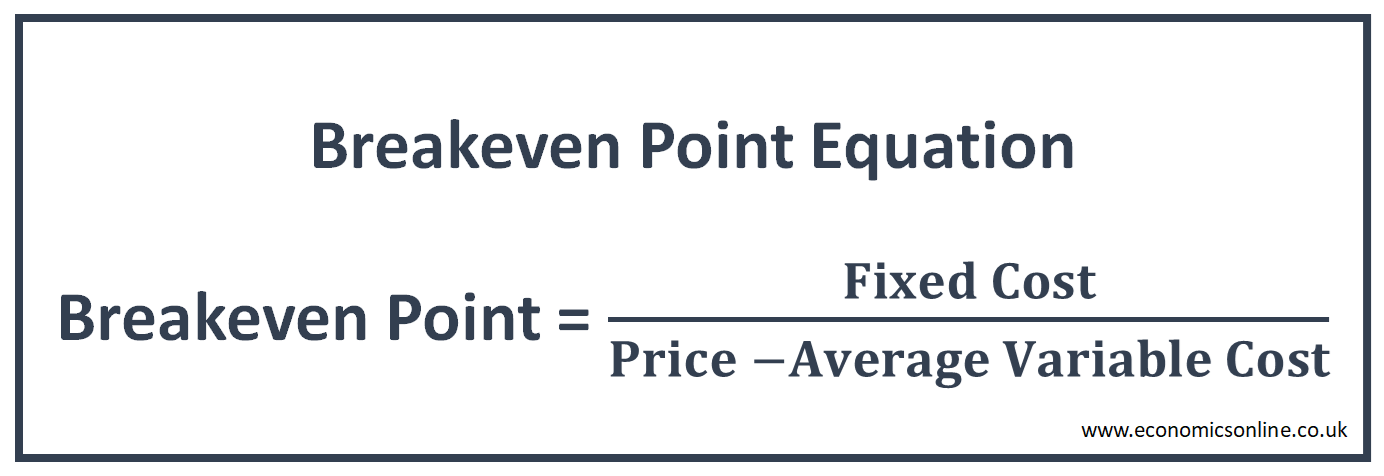
Break-even equation is the formula to calculate break-even point. This break-even point formula has a fixed cost, an average variable cost, and a price. The answer of breakeven point is in terms of units of output produced and sold so that total revenue becomes equal to total cost. Break-even equation is given below:
Break-Even Point = Fixed Cost / (Price – Average Variable Cost)

The denominator of this formula is called unit contribution, which is the difference between the price of a product and its average variable cost.
Unit Contribution = Price – Average Variable Cost
Assumptions of Break-Even Analysis
The following are the assumptions of break-even point analysis:
- Price is constant.
- Average variable cost is constant.
- Fixed cost remains fixed for all the units of output under consideration.
- All the output produced is sold in the market.
Understanding Break-Even Analysis
The break-even analysis helps business firms calculate the output for which the amount of revenue earned will cover all the fixed and variable costs. This means that the business will not incur loss and will survive in the market. For example, if breakeven point is 200 units, it means that if this quantity is produced and sold, business will cover all the costs from the revenue of this quantity.
Methods to Calculate Break-Even Point
The following two methods are used to calculate the break-even point (BEP):
Formula Method
In this method, a break-even formula is used to calculate the value of the break-even quantity. Let’s consider the example of a bakery selling cakes. The breakeven point will be the minimum number of cakes to be sold in order to cover all the costs. Suppose that the fixed cost of bakery is $2000 per month. The average variable cost (AVC) is $30 per cake, out of which $10 is for the raw materials used in producing cakes and $20 is for the direct labour cost. Each cake is sold for a price of $40.
Fixed Cost = $2000 per month
Price = $40 per cake
Average Variable Cost (AVC) = $30 per cake
Let’s put these values in the following formula:
Break-even Point in Units = Fixed Cost/(Price – AVC) = $2000/($40 - $30) = 200 cakes
According to this calculation, the bakery has to sell 200 cakes to breakeven. It means that by selling 200 cakes, total sales revenue will become equal to total cost and there will be no profit or loss. Let’s check this by making the following financial calculations.
For 200 cakes,
Total Revenue = Price x Quantity = $40 x 200 units = $8000
Fixed Cost = $2000
Total Variable Cost = AVC x Quantity = $30 x 200 units = $6000
Total Cost = Fixed Cost + Variable Cost = $2000 + $6000 = $8000
Total Revenue = Total Cost = $8000
Profit / Loss = Total Revenue – Total Cost = $8000 - $8000 = 0
It is clear from the above figures that by selling the breakeven output of 200 cakes, total revenue and total cost are equal to $8000. There is no profit or loss for this breakeven quantity. It means that the bakery must sell 200 cakes in order to avoid losses. Selling fewer than 200 cakes will generate loss. Selling more than 200 cakes will generate profit.
Graphical Method
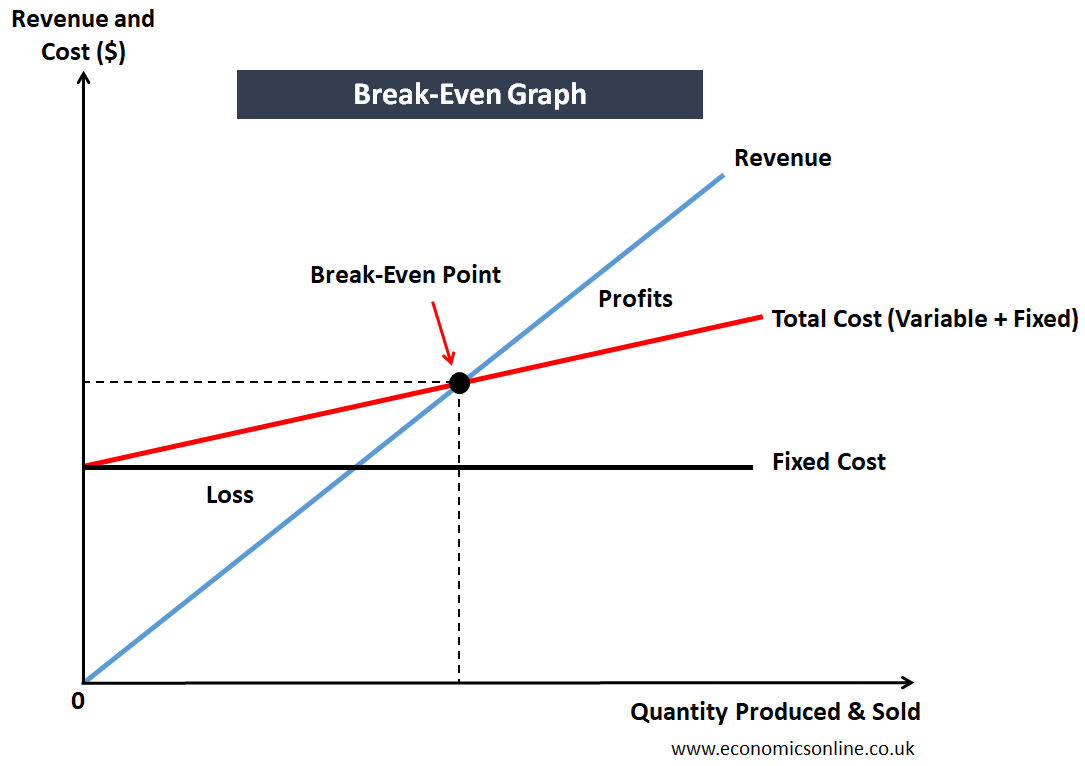
In this method, a break-even graph is used to calculate the break-even point.

In the above breakeven chart, we have the quantity produced and sold on the horizontal axis (x-axis) and revenue and cost on the vertical axis (y-axis). Fixed cost is a straight line parallel to x-axis because it remains fixed irrespective of the level of output produced. The total revenue is a straight, upward sloping line. It is a straight line because of the assumption of fixed price. The total cost is shown by an upward sloping line starting from the level of fixed cost. The point at which both total costs and total revenue curves meet each other is the break-even point.
Components of Break-Even Analysis
The break-even analysis consists of four components, which are fixed cost, average variable cost, unit contribution, and price.
Fixed Costs
The total fixed costs are also called overhead costs, as they are not directly related to the quantity of production. The fixed costs are an important component of production costs and consist of interest rates, rent, salaries, and energy costs. These costs are fixed, whether there is production or not.
Average Variable Cost
This is also called the variable cost per unit of output. In breakeven analysis, average variable cost is assumed to be constant. This cost may consist of raw materials, direct labor costs, utilities, and packaging costs of making one unit of output.
Price
This is the amount of money at which each unit of output is sold to generate revenue. It is also called the selling price or sale price. In breakeven analysis, price is assumed to be constant.
Unit Contribution
Unit contribution is the difference between price and average variable cost. It is also called contribution margin. The value of the unit contribution should be positive (price should be greater than average variable cost) in order to calculate the breakeven point.
Importance of Break-Even Analysis
Breakeven analysis is an excellent tool for making various business decisions. The following are some reasons why the break-even analysis is important:
Pricing
With the help of break-even analysis, businesses can set a price for its products that can cover all the costs, including fixed and variable costs. This pricing method is called breakeven pricing in marketing.
Location Decision
Breakeven Analysis can also be used to determine the optimal location for a business. Each location has its own fixed cost, average variable cost and price. That location is considered optimal which has the lowest breakeven point.
New Product Launch
Before launching new products in the market, breakeven analysis is used to select that product with the lowest breakeven, so that costs can be covered quickly by selling less number of units and profits can be started early. The products with higher breakeven values are avoided.
Production and Sales Target
Once the breakeven point is calculated, it is used by business owners as production and sales targets so that, at least, a business firm can survive in the market by covering all of its costs.
Starting New Business
When a new venture or business is going to start, break-even analysis is used to identify whether the idea of a startup is realistic in terms of cost or not. It also provides a basic pricing strategy to investors for their startups.
Cost Reduction
Businesses can use break-even analysis to identify areas where they can reduce costs and enhance the profitability of their business.
What-If Analysis
Businesses can also do what-if analysis for different scenarios by using breakeven equation. For example, what will happen if price, fixed cost or average variable cost is changed? Simply speaking, breakeven point will increase due to a decrease in price and increase in any of the fixed or variable costs.
Limitations of Break-Even Analysis
While using breakeven analysis in decision making, its limitations should also be kept in mind. For example, the assumption of constant price is quite strong. In reality, firms may reduce price for customers with a large order size. Moreover, average variable cost is not constant. The assumption of all the production output being sold is also unrealistic because there is no guarantee of selling all the units which were produced. There may be some unsold stock of products in real life.
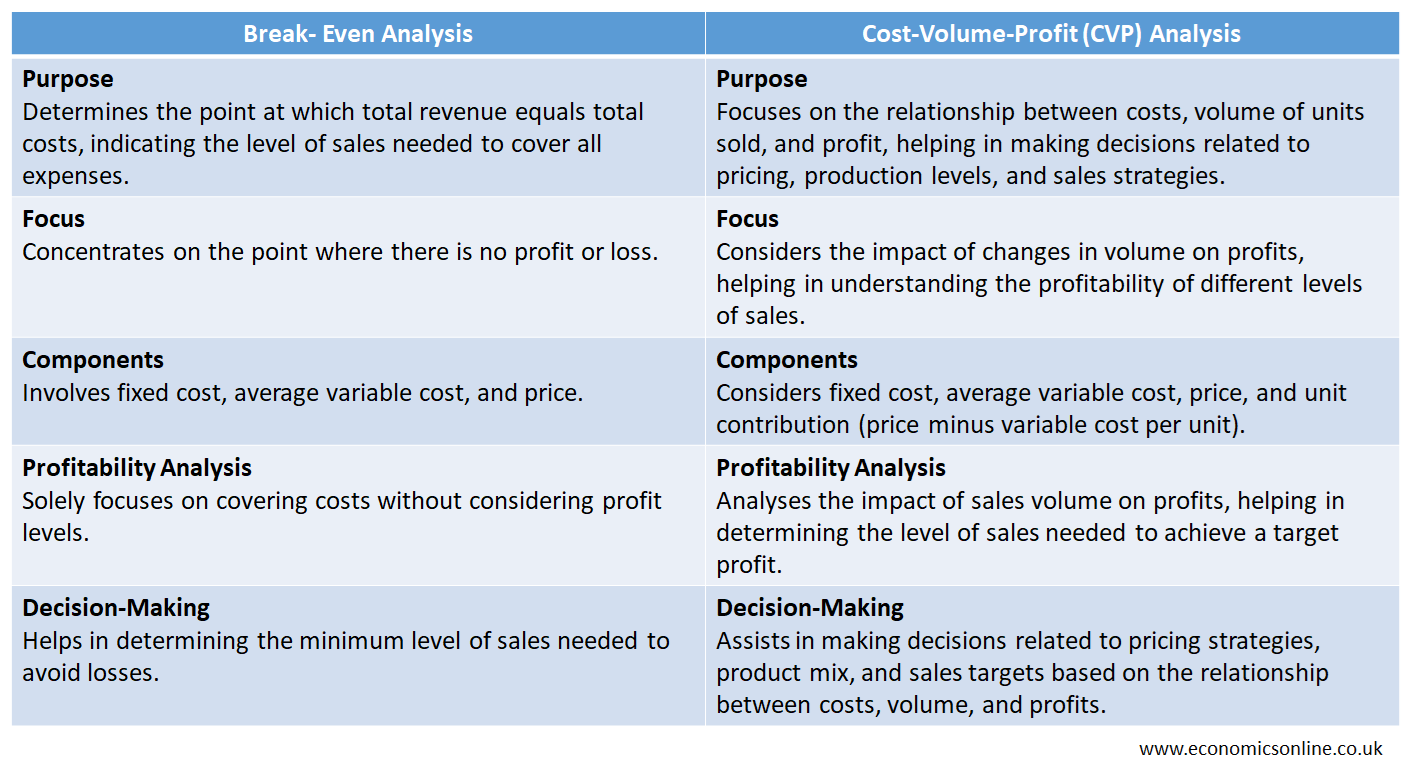
Differences between Break-Even Analysis and Cost-Volume-Profit (CVP) Analysis
The following table contains the main points of difference between BE analysis and CVP analysis:

Conclusion
In conclusion, break-even analysis is a quantitative tool that is used by businesses in order to determine what minimum sales volume is required to cover all the costs incurred and reach break-even. It is also helpful in making pricing strategies and managing operations.


