
Photo by Jakub Żerdzicki / Unsplash
ATC Curve
Introduction
Cost means the spending of money by a business to run its operations and generate revenue. All businesses incur costs. The concept of cost is important in economics, business, commerce, accounting and other related subjects. Cost information is used by business firms in calculating profit or loss, setting price of products, finding breakeven points, deciding location of business, improving business efficiency and so on. In this article, we will discuss average total cost (ATC) in detail.
Average Total Cost Definition
The total cost per unit of a product or service is called the average total cost (ATC) or average cost (AC). When a firm’s total cost, including fixed cost (FC) and variable cost (VC), is divided by the number of units of output produced in a certain time period, it is known as the average total cost (ATC). The average total cost is also known as the average cost because it is the per-unit cost incurred to produce a product. ATC is one type among many different types of costs.
Average Total Cost Formula
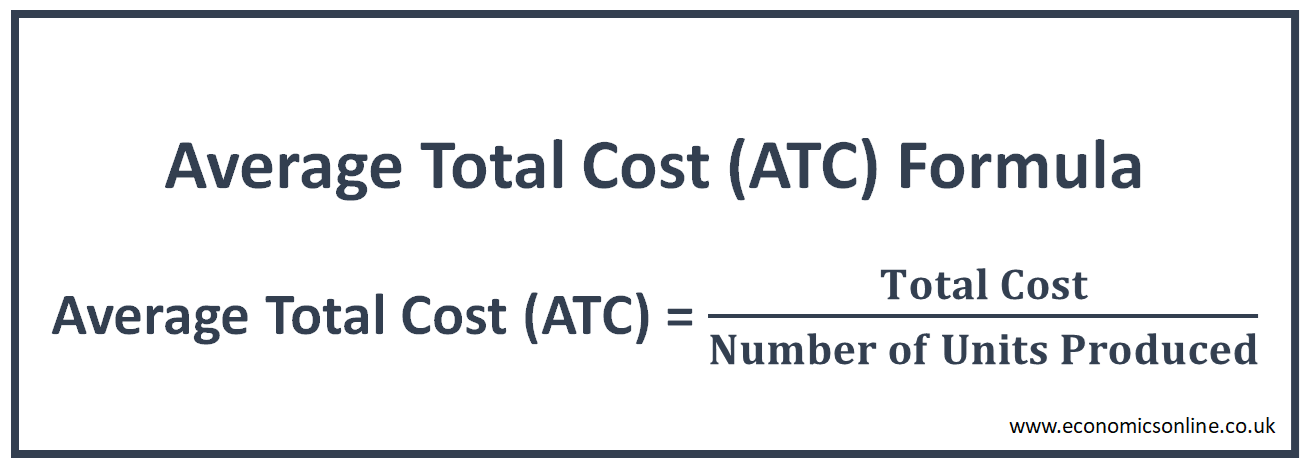
Here is the formula to calculate ATC:
Average Total Cost = Total Cost / Number of Units Produced
ATC = TC / Q
Total cost is the sum of total fixed cost and total variable cost.
Total Cost = Total Fixed Cost + Total Variable Cost
TC = TFC + TVC
ATC can also be calculated by adding the average fixed cost and the average variable cost, which are defined on a per-unit basis. Here is the formula:
Average Total Cost = Average Fixed Cost + Average Variable Cost
ATC = AFC + AVC
Calculation Example
Let's have numerical calculations of ATC. For example, a firm is producing 100 units per day of a certain product. Its total cost is $500, including the fixed cost of $300 and the variable cost of $200. We can calculate ATC by putting values in the above formula:
Average Total Cost = Total Cost / Number of Units Produced
ATC = $500 / 100 = $5 per unit
According to the above average cost calculation, the firm’s ATC is $5.
Graph of Average Total Cost
The following graph illustrates average total cost in the short run:
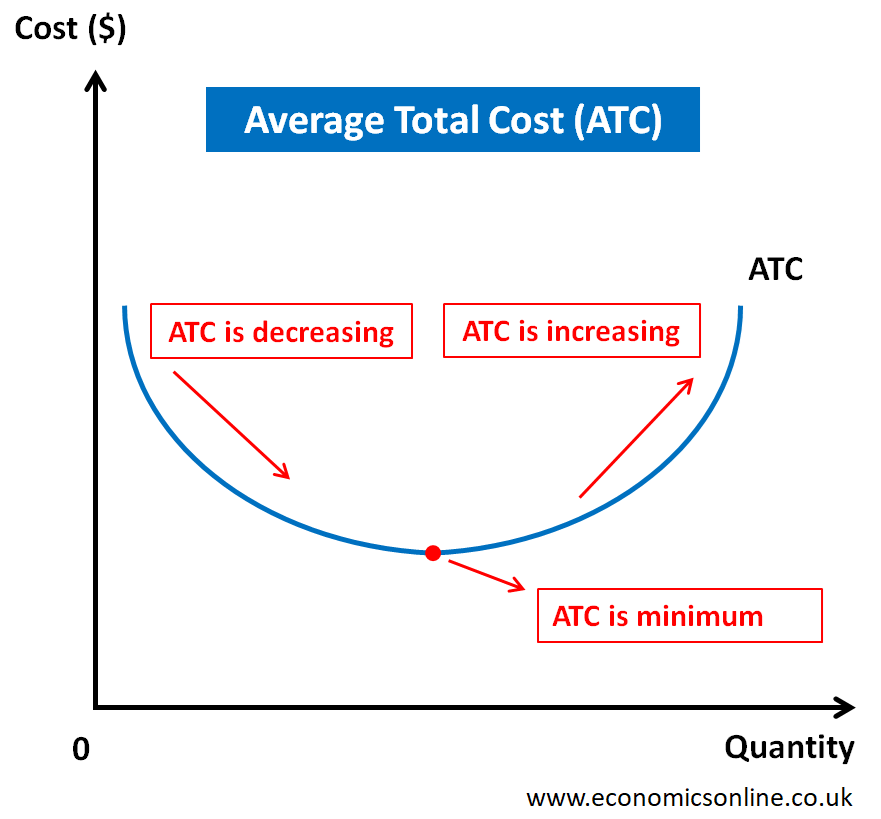
In the above graph, quantity produced is taken on the horizontal axis (x-axis), while cost is taken on the vertical axis (y-axis). The short run ATC curve is U-shaped because of the law of diminishing returns. First, the ATC curve goes down to its minimum point and then starts to go up with the increase in levels of output.
Features of Average Total Cost
The following are the main features of short run ATC:
- ATC is defined for a single unit of output.
- ATC is different from marginal cost.
- The graph of average total cost (ATC curve) is U-shaped.
- Initially, ATC decreases because of increasing returns, as per the law of diminishing marginal returns.
- Finally, ATC increases because of decreasing returns, as per the law of diminishing marginal returns.
- The minimum point of ATC (the bottom of the average cost curve) is where it cuts the marginal cost curve (MC curve).
Why is ATC Curve U-Shaped?
The above graph of short-run average total cost shows a U-shaped curve. This U-shape of the ATC curve is due to the law of diminishing marginal returns, which operates in the short run. At first, the ATC curve is relatively high because there is a large contribution of fixed costs in the average total cost. Then the ATC curve starts decreasing because of increasing returns as more units of variable factors of production are added to the fixed factors of production. But, when the diminishing returns set in, the ATC curve reversed its course and started moving upward.
Graph of Long Run Average Total Cost
In economics, long run is a time period in which all the factors of production are variable. The following graph illustrates average total cost in the long run:
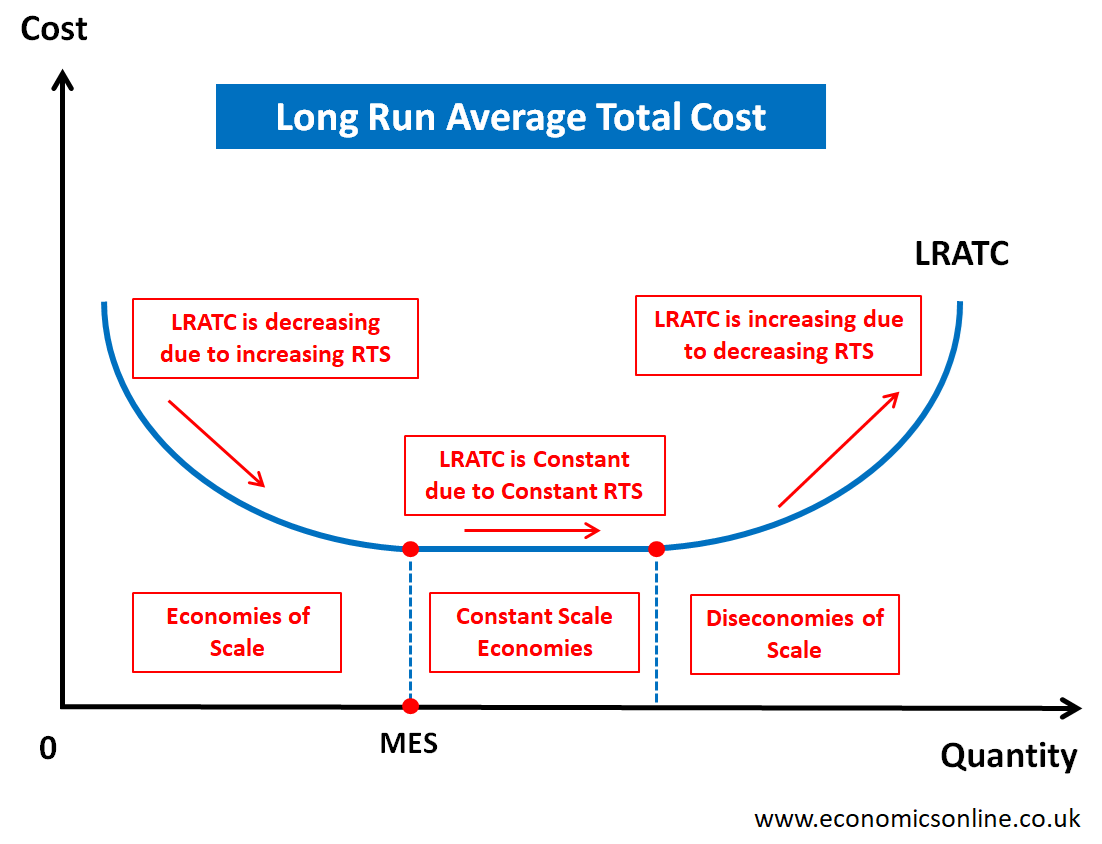
As shown above, the long-run average total cost curve is also U-shaped. But this shape is due to the law of returns to scale, which operates in the long run.
Initially, LRATC is decreasing due to increasing returns to scale (RTS). This is called economies of scale. The minimum quantity of output for the minimum point of the ATC curve, is called the minimum efficient scale (MES). The horizontal part of LRATC curve is due to the constant returns to scale (RTS). Finally, LRATC increases due to increasing returns to scale, and is called diseconomies of scale.
It should be noted that the above graphs show the general patterns of these curves, and in real life, the shapes may vary significantly from these patterns.
Methods to Calculate Average Total Cost
The following are two methods to calculate average total cost:
Division Method
In the division method, the average total cost is calculated by dividing the total cost incurred by the number of units produced in a given time period.
Average Total Cost = Total Cost / Number of Units Produced
The following are three main steps that are used in division method:
Number of Units Produced
The first step is to find the total quantity of output produced in a given period of time.
Total Cost
The second step is to identify the total cost incurred to produce those units of output.
Division Process
The third and last step is to put all the values in the ATC formula and divide the total cost by the denominator of quantity produced. In this way, we get the value of average total cost.
Addition Method
In the addition method, average total cost is calculated by adding the values of average fixed cost and average variable cost.
Average Total Cost = Average Fixed Cost + Average Variable Cost
The following are the three main steps that are used in the addition method:
Average Fixed Cost
The first step is to calculate average fixed cost, which can be found by dividing total fixed cost by the number of units produced.
Average Fixed Cost = Total Fixed Cost / Number of Units Produced
Average Variable Cost
The second step is to calculate average variable cost, which can be found by dividing the total variable cost incurred by the number of units produced.
Average Variable Cost = Total Variable Cost / Number of Units Produced
Addition Process
The third step is to add the values of average fixed cost and average variable cost, and then we get the value of the average total cost.
Average Total Cost = Average Fixed Cost + Average Variable Cost
Significance of Average Total Cost
The following points explain the significance of average total cost:
Costing
Costing means the process of calculating the cost of making a product. ATC is calculated as the product cost in absorption costing, in which both fixed and variable costs are considered part of the product cost.
Pricing
Pricing means setting the price of a product. Normally, price of a product is set above its ATC, so that some profit can be made from the sale of the product. In the absence of ATC information, the price may be set wrongly below ATC, which may result in a loss. The pricing technique based on ATC is called cost based pricing.
Production Decision
ATC is used in the long run continuity decision of production in a business. In economics, firms should continue production in the long run if average revenue or price is greater than or equal to average total cost. The firms should stop production in the long run if average revenue or price is less than the average total cost.
Profit Calculation
The ATC curve is used in various types of market structures (perfect competition, monopoly, monopolistic competition, and oligopoly) in order to calculate and show average economic profit, which is the difference between average revenue and ATC.
Average Profit = Average Revenue – Average Total Cost
Efficiency
Improving the efficiency of business is considered important for increasing its profit. Efficiency improvements can be measured through the reduction in ATC.
Relationship between Marginal Cost and Average Total Cost
The marginal cost of production (MC) is the extra cost of producing one more unit of the firm's output. The idea of the marginal cost is important in determining the changes in ATC. The following graph illustrates the relationship between MC and ATC:
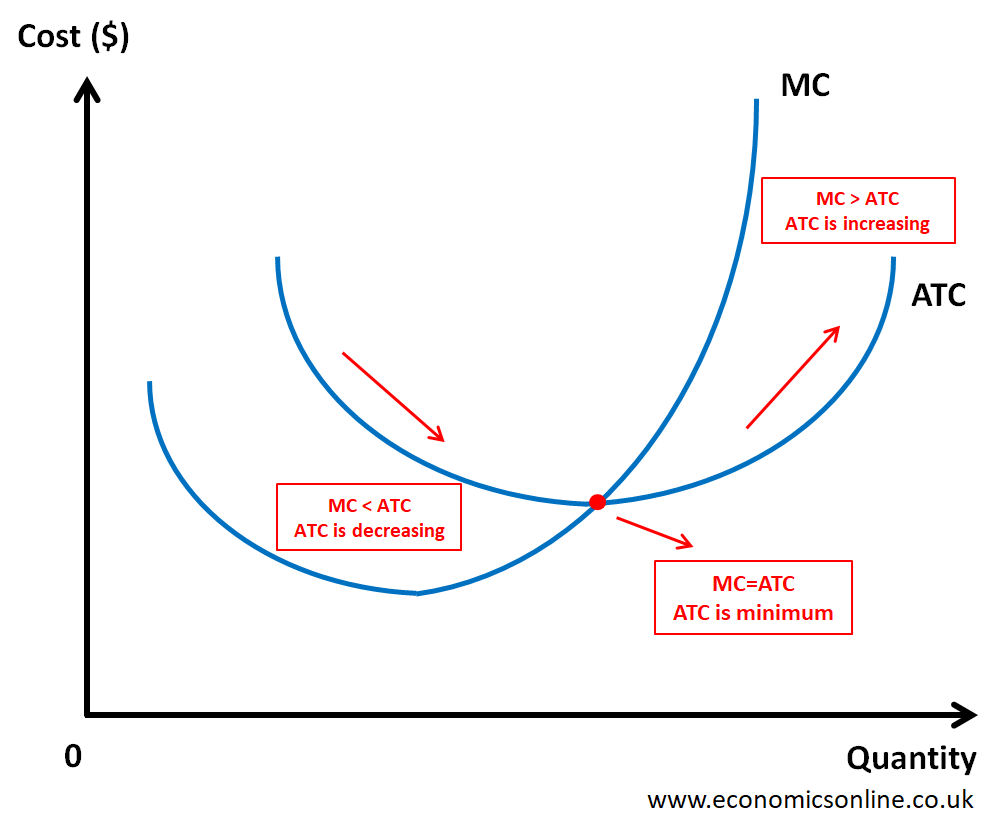
In the above graph, the following three points are important:
- When MC is less than ATC, ATC is decreasing.
- When MC is equal to ATC ( at the point of intersection or point of transition of MC and ATC), ATC is minimum.
- When MC is greater than ATC, ATC is increasing, as shown by the right side of the average cost curve in the above graph.
Conclusion
In conclusion, the average total cost can be obtained by dividing total cost by total output produced. ATC is an important figure which is used by business firms in cost control and profit calculations. The ATC curve and MC curve are related to each other as the ATC curve first slops downward, but when it meets or intersects the MC curve, it has its minimum point, after which it starts increasing with the increasing quantity of output produced.

