
Liquidity Trap
What is a Liquidity Trap?
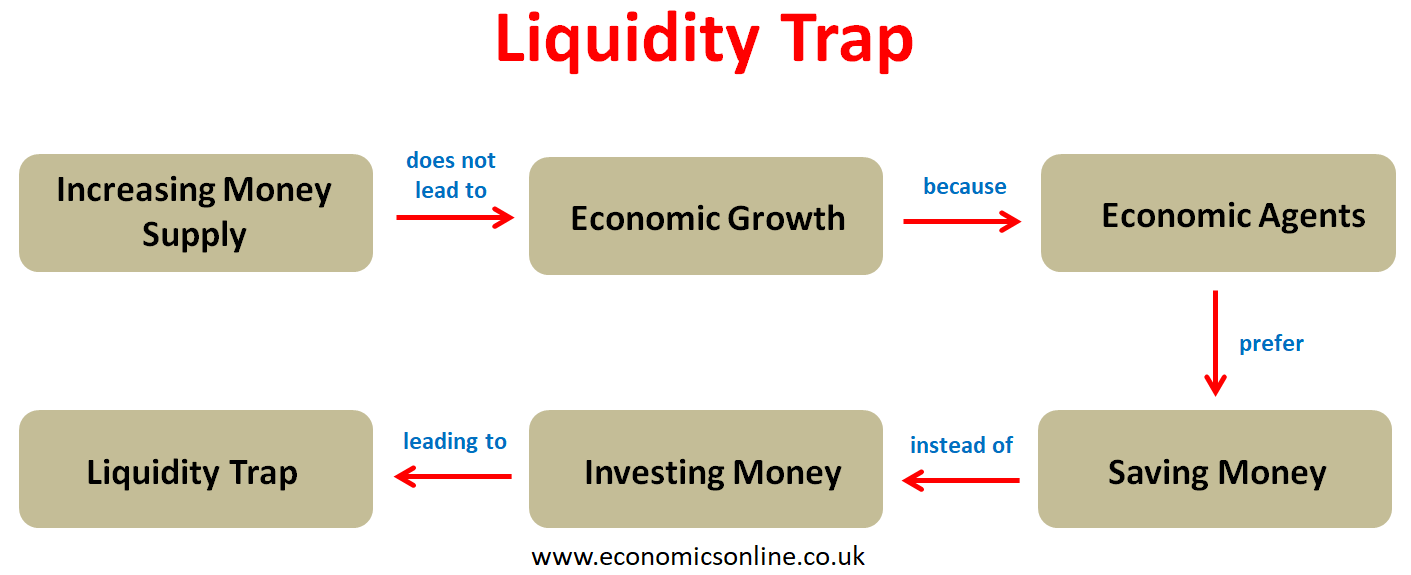
A liquidity trap refers to a situation in an economy where an increase in the money supply has no effect on the interest rate. During a liquidity trap, the expansionary monetary policy (an increase in the money supply) becomes impotent and powerless in affecting the interest rate, aggregate demand, and economic growth.
Any increase in the money supply does not affect the already low interest rate, and it does not lead to economic growth. This happens because economic agents prefer saving money instead of investing it in bond purchases or buying other debt instruments, leading to a liquidity trap.
Origin
The term liquidity trap was coined by the economist John Maynard Keynes in 1936 in his famous theory of interest rate determination, that is, the liquidity preference theory. It is considered an important concept in macroeconomics to understand the workings of the whole economy.
Understanding the Liquidity Trap
In liquidity preference theory, the interest rate is determined by using the forces of demand for money (liquidity preference) and supply of money. People hold cash or prefer liquidity (liquidity preference) due transactionary, precautionary and speculative motives. This demand for money or liquidity preference is shown by the downward sloping LP curve in the following diagram. Money supply (MS) is a vertical line because it is controlled by the central bank of the country and is not dependent on interest rates.
Normally, an increase in the money supply will cause the interest rate to fall. This is illustrated in the following diagram as follows:
- The liquidity preference (LP) curve is downward sloping initially.
- The money supply is increased from MS0 to MS1.
- The equilibrium is shifted from E0 to E1.
- The quantity of money is increased from Q0 to Q1.
- The interest rate is decreased from r0 to r1.
This decrease in interest rate is the usual outcome of an increase in the money supply under expansionary monetary policy. This fall in the interest rate will increase aggregate demand and national output, leading to economic growth. Here, expansionary monetary policy is considered effective in boosting economic growth.
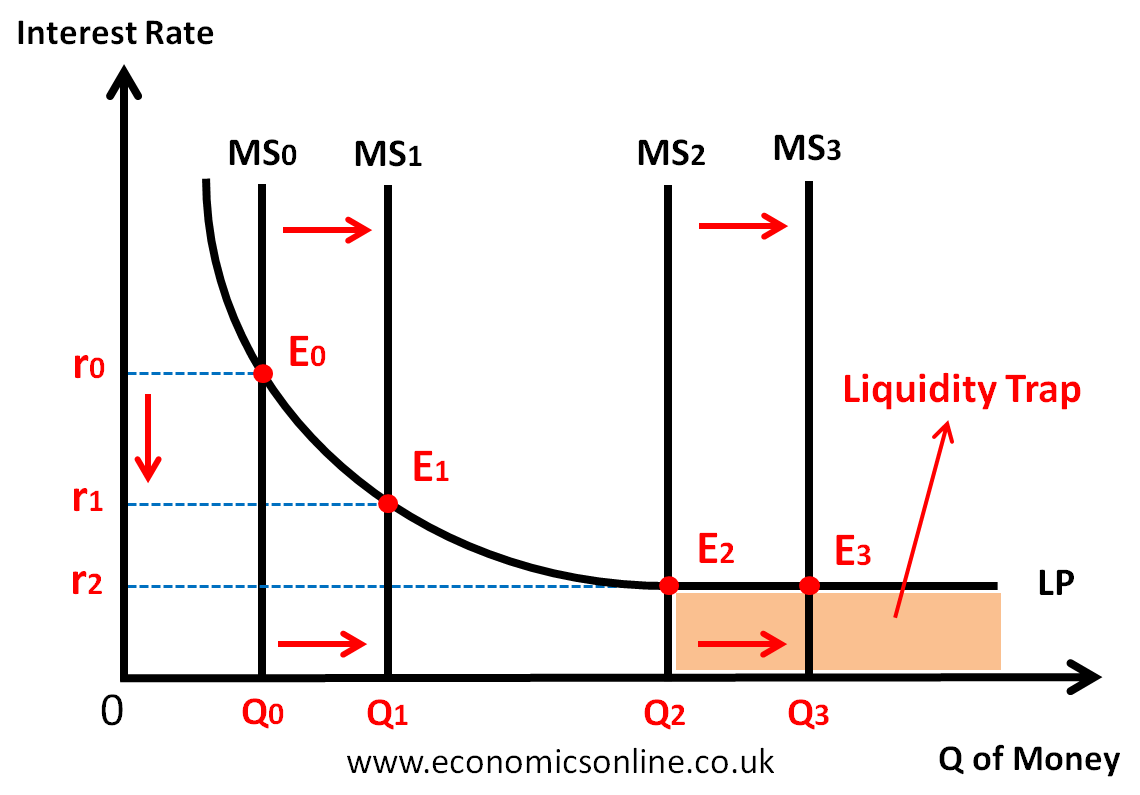
However, at a low interest rate (r2), liquidity preference (LP) becomes perfectly interest elastic (horizontal), and an increase in money supply does not affect the short-term interest rate. Keynes described this situation as a liquidity trap. This is illustrated in the above diagram, which shows the graphical representation of the liquidity trap. In the above diagram,
- The liquidity preference (LP) curve is perfectly interest elastic (horizontal) at a low interest rate of r2.
- The money supply is increased from MS2 to MS3.
- The equilibrium is shifted from E2 to E3.
- The quantity of money is increased from Q2 to Q3.
- The interest rate does not change, and it remains the same at r2.
Hence, at a low interest rate of r2, an increase in money supply has become ineffective in decreasing the interest rate and hence boosting aggregate demand and national output.
In a liquidity trap, people prefer to hold large amounts of cash (high liquidity), and they don’t put their cash into government bonds or other debt instruments. They're "trapped" in holding onto large amounts of cash, and this happens when the interest rate is low and bond prices are high.
Liquidity Trap situations
There are three main situations in which liquidity trap occur:
- When the rate of interest is very low (sometimes zero, which is also called the zero bound or zero lower bound).
- When the economy is in recession.
- Monetary policy is ineffective and unable to further reduce low interest rates.
Liquidity Trap and the IS-LM Model
Let’s explain the liquidity trap by using the IS-LM model.
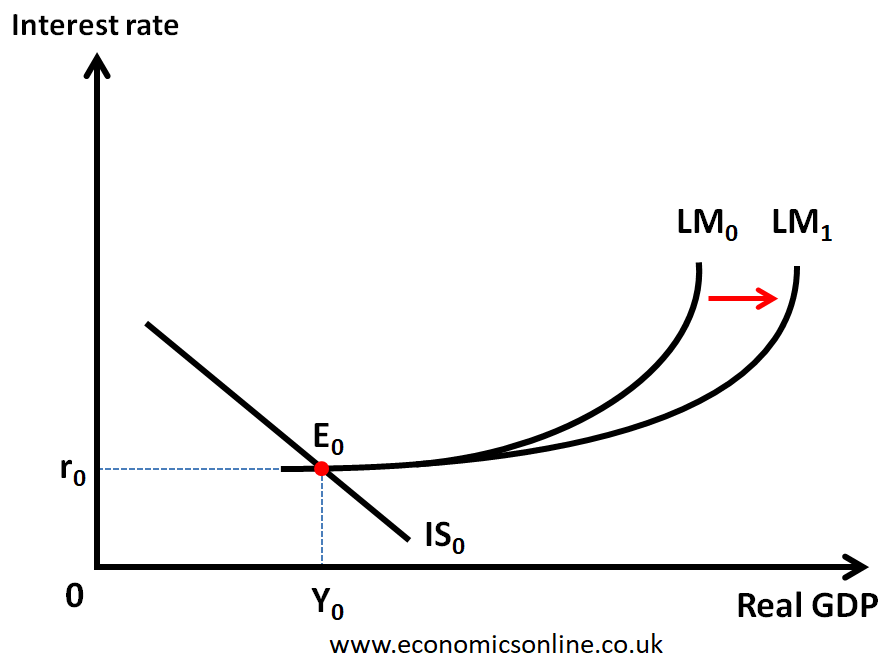
In the above graph, national income (Y) is represented on the horizontal axis (x-axis), while the interest rate is represented on the vertical axis (y-axis). The investment-saving (IS) curve is IS0, and the initial liquidity preference-money supply (LM) curve is LM0. The initial equilibrium is at E0 at the point of intersection of the two curves, where the interest rate is R0 and the real GDP is Y0.
When the money supply is increased as part of expansionary monetary policy, the LM curve is shifted from LM0 to LM1. But it has no effect on the interest rate or the real GDP of the country. This is a liquidity trap where any increase in money supply (expansionary monetary policy) becomes ineffective in changing the interest rate and the real GDP of the country.
Characteristics of Liquidity Trap
A liquidity trap occurs when businesses, investors, and consumers decide to hoard their cash, and the resulting economy is resistant to any monetary policy actions to stimulate economic activity.
The following are the characteristics of liquidity trap:
- low nominal interest rates
- High savings
- low inflation or deflation
- economic recession or depression
- expectations of prolonged economic weakness
- ineffective expansionary monetary policy
- preference for saving rather than spending and investment.
- increase in output gap due to persistent deflation.
The Central Bank and Liquidity Trap
People believe, and they are right in believing so, that the main job of the central bank, such as the Federal Reserve (Feds), is to manage interest rates or policy rates to induce economic growth in the economy. Normally, an increase in money supply decreases the interest rate, leading to an increase in aggregate demand through an increase in consumption and investment, which leads to economic growth.
However, during the liquidity trap, the interest rate is already as low as it can go. Any increase in money supply has no effect on already lower interest rates, and there is no effect on aggregate demand or the real GDP of the country. In this way, the central bank’s expansionary monetary policy will not trigger economic growth in the country, and this is bad news for monetary policymakers.
Real-World Examples of Liquidity Trap
The following are some real world examples of the liquidity trap:
The Great Depression
The Great Depression (1929–1933) is a classic example of the liquidity trap. During that time, the interest rate was very low; there was a lack of demand for goods and services, and people were holding money instead of investing it. An increase in the money supply through the printing of money remained useless in inducing economic growth.
Japan’s Lost Decade
Another example of the liquidity trap is Japan’s lost decade (1991–2001), when Japan was hit by an economic recession. During this time of Japan's slump, the interest rate was around 0.5% and the bank of Japan could do no more to decrease it further. This low interest rate failed to get the economy out of recession due to the liquidity trap.
The COVID-19 Recession
During the COVID-19 pandemic, people held large amounts of cash and decreased investment as a precautionary measure due to the prevailing uncertainty. This cautious behaviour hindered the effectiveness of monetary policy and created the liquidity trap.
Liquidity Trap and Fiscal Policy
Since expansionary monetary policy is ineffective in triggering economic growth during the liquidity trap, Keynesian economists suggest that the best way to get out of this trap is through the use of expansionary fiscal policy (increase in government spending and tax cuts). This solution was originally proposed by John Maynard Keynes during the Great Depression as an optimal policy. This is illustrated by the following diagram.
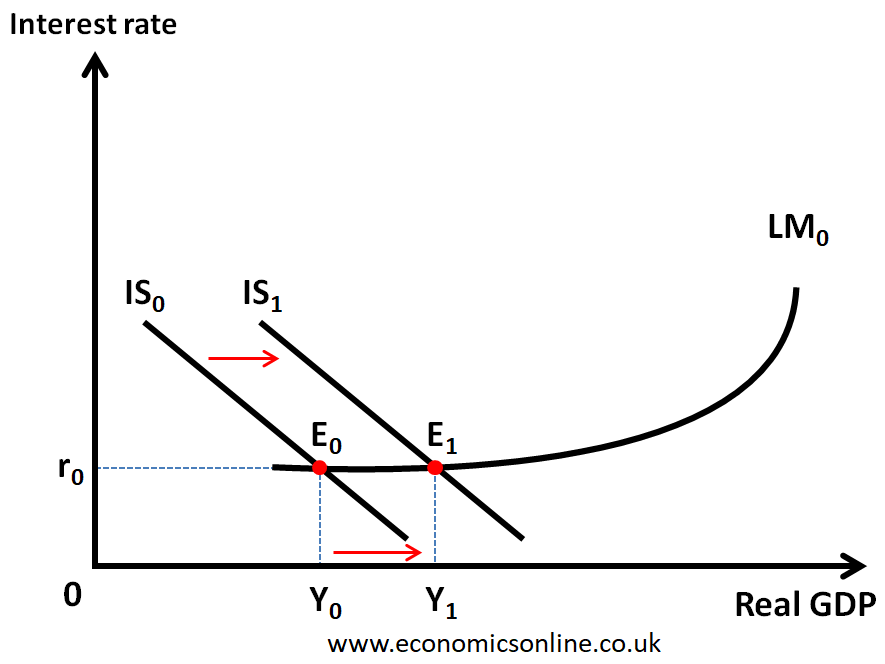
In the above diagram, an expansionary fiscal policy will shift the IS curve from IS0 to IS1 leading to an increase in the real GDP of the country from Y0 to Y1. This fiscal stimulus will not create any crowding out effect because the interest rate remains unchanged.
The liquidity trap is a problem that is related to the behaviour of economic agents. The use of expansionary fiscal policy is one solution to this problem. The government can also use quantitative easing in order to overcome the liquidity trap.
Conclusion
A liquidity trap is a situation in which the interest rate is very low, savings are high, and economies become stagnant. It is an important concept in economics with reference to the liquidity preference theory. The liquidity trap limits the effectiveness of expansionary monetary policy. Countries can use expansionary fiscal policy to get out of the liquidity trap, as suggested by Keynes.