Costs
Costs of production
Fixed and variable costs
Fixed costs are those that do not vary with output and typically include rents, insurance, depreciation, set-up costs, and normal profit. They are also called overheads.
Variable costs are costs that do vary with output, and they are also called direct costs. Examples of typical variable costs include fuel, raw materials, and some labour costs.
Try a quiz on costs
An example
Consider the following hypothetical example of a boat building firm. The total fixed costs, TFC, include premises, machinery and equipment needed to construct boats, and are £100,000, irrespective of how many boats are produced. Total variable costs (TVC) will increase as output increases.
| OUTPUT | TOTAL FIXED COST | TOTAL VARIABLE COST | TOTAL COST |
| 1 | 100 | 50 | 150 |
| 2 | 100 | 80 | 180 |
| 3 | 100 | 100 | 200 |
| 4 | 100 | 110 | 210 |
| 5 | 100 | 150 | 250 |
| 6 | 100 | 220 | 320 |
| 7 | 100 | 350 | 450 |
| 8 | 100 | 640 | 740 |
Plotting this gives us Total Cost, Total Variable Cost, and Total Fixed Cost.
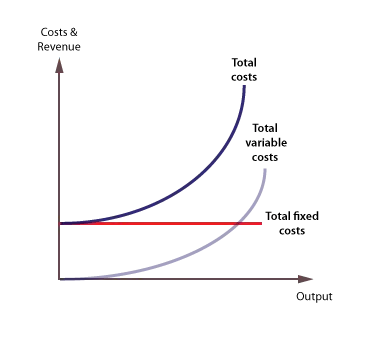
Total fixed costs
Given that total fixed costs (TFC) are constant as output increases, the curve is a horizontal line on the cost graph.
Total variable costs
The total variable cost (TVC) curve slopes up at an accelerating rate, reflecting the law of diminishing marginal returns.
Total costs
The total cost (TC) curve is found by adding total fixed and total variable costs. Its position reflects the amount of fixed costs, and its gradient reflects variable costs.
Average fixed costs
Average fixed costs are found by dividing total fixed costs by output. As fixed cost is divided by an increasing output, average fixed costs will continue to fall.
| OUTPUT | TOTAL FIXED COST (£000) | AVERAGE FIXED COST (£000) |
| 1 | 100 | 100 |
| 2 | 100 | 50 |
| 3 | 100 | 33.3 |
| 4 | 100 | 25 |
| 5 | 100 | 20 |
| 6 | 100 | 16.6 |
| 7 | 100 | 14.3 |
| 8 | 100 | 12.5 |

The average fixed cost (AFC) curve will slope down continuously, from left to right.
Average variable costs
Average variable costs are found by dividing total fixed variable costs by output.
| OUTPUT | TOTAL VARIABLE COST (£000) | AVERAGE VARIABLE COST (£000) |
| 1 | 50 | 50 |
| 2 | 80 | 40 |
| 3 | 100 | 33.3 |
| 4 | 110 | 27.5 |
| 5 | 150 | 30 |
| 6 | 220 | 36.7 |
| 7 | 350 | 50 |
| 8 | 640 | 80 |

The average variable cost (AVC) curve will at first slope down from left to right, then reach a minimum point, and rise again.
AVC is ‘U’ shaped because of the principle of variable Proportions, which explains the three phases of the curve:
- Increasing returns to the variable factors, which cause average costs to fall, followed by:
- Constant returns, followed by:
- Diminishing returns, which cause costs to rise.
Average total cost
Average total cost (ATC) is also called average cost or unit cost. Average total costs are a key cost in the theory of the firm because they indicate how efficiently scarce resources are being used. Average variable costs are found by dividing total fixed variable costs by output.
| OUTPUT | AVERAGE FIXED COST (£000) | AVERAGE VARIABLE COST (£000) | AVERAGE TOTAL COSTS (£000) |
| 1 | 100 | 50 | 150 |
| 2 | 50 | 40 | 90 |
| 3 | 33.3 | 33.3 | 67 |
| 4 | 25 | 27.5 | 52.5 |
| 5 | 20 | 30 | 50 |
| 6 | 16.6 | 36.7 | 53.3 |
| 7 | 14.3 | 50 | 64.3 |
| 8 | 12.5 | 80 | 92.5 |
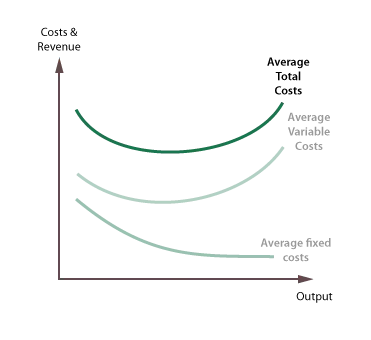
Average total cost (ATC) can be found by adding average fixed costs (AFC) and average variable costs (AVC). The ATC curve is also ‘U’ shaped because it takes its shape from the AVC curve, with the upturn reflecting the onset of diminishing returns to the variable factor.
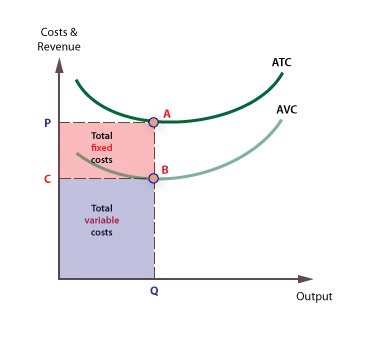
Areas for total costs
Total Fixed costs and Total Variable costs are the respective areas under the Average Fixed and Average Variable cost curves.
Marginal costs
Marginal cost is the cost of producing one extra unit of output. It can be found by calculating the change in total cost when output is increased by one unit.
| OUTPUT | TOTAL COST | MARGINAL COST |
| 1 | 150 | |
| 2 | 180 | 30 |
| 3 | 200 | 20 |
| 4 | 210 | 10 |
| 5 | 250 | 40 |
| 6 | 320 | 70 |
| 7 | 450 | 130 |
| 8 | 740 | 290 |
It is important to note that marginal cost is derived solely from variable costs, and not fixed costs.
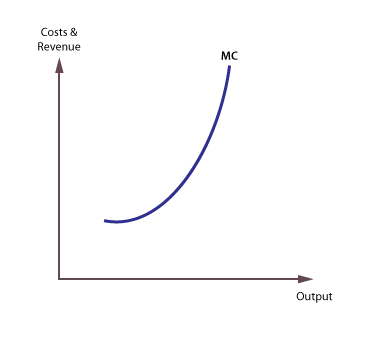
The marginal cost curve falls briefly at first, then rises. Marginal costs are derived from variable costs and are subject to the principle of variable proportions.
The significance of marginal cost
The marginal cost curve is significant in the theory of the firm for two reasons:
- It is the leading cost curve, because changes in total and average costs are derived from changes in marginal cost.
- The lowest price a firm is prepared to supply at is the price that just covers marginal cost.
ATC and MC
Average total cost and marginal cost are connected because they are derived from the same basic numerical cost data. The general rules governing the relationship are:
- Marginal cost will always cut average total cost from below.
- When marginal cost is below average total cost, average total cost will be falling, and when marginal cost is above average total cost, average total cost will be rising.
- A firm is most productively efficient at the lowest average total cost, which is also where average total cost (ATC) = marginal cost (MC).
Total costs and marginal costs
Marginal costs are derived exclusively from variable costs, and are unaffected by changes in fixed costs. The MC curve is the gradient of the TC curve, and the positive gradient of the total cost curve only exists because of a positive variable cost. This is shown below:

Sunk costs
Sunk costs are those that cannot be recovered if a firm goes out of business. Examples of sunk costs include spending on advertising and marketing, specialist machines that have no scrap value, and stocks which cannot be sold off.
Sunk costs are a considerable barrier to entry and exit.