Sustainable growth
Sustainable growth
Economic growth occurs when real output increases over time. Real output is measured by Gross Domestic Product (GDP) at constant prices, so that the effect of price rises on the value of national output is removed.
Sustainable economic growth means a rate of growth which can be maintained without creating other significant economic problems, especially for future generations. There is clearly a trade-off between rapid economic growth today, and growth in the future. Rapid growth today may exhaust resources and create environmental problems for future generations, including the depletion of oil and fish stocks, and global warming.
Periods of growth are often triggered by increases in aggregate demand, such as a rise in consumer spending, but sustained growth must involve an increase in output. If output does not increase, any extra demand will push up the price level.
Growth based on debt
In terms of sustainability, it may be argued that growth based on short-term public debt, rather than long term productivity, is unsustainable – hence worries about the build-up of sovereign debt in Europe.
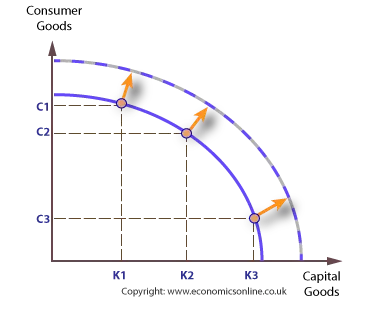
PPFs and economic growth
For an economy to continue to grow in the future, it needs to increase its capacity to grow. An increase in an economy’s productive potential can be shown by an outward shift in the economy’s PPF.
Standards of living
Gross domestic product per capita is often regarded as the key indicator of the standards of living of the citizens of an economy, and of their economic welfare, though broader measures of economic welfare are increasingly used in preference to narrow GDP measures.
Measuring growth
GDP is the official base measure of output used in most economies, including the UK. Gross measurements record the output of all goods and services, including capital goods which have been purchased to replace existing capital goods. Replacing capital is called capital consumption, or depreciation. The alternative to Gross output is Net output, which indicates that depreciation is taken into account and deducted from the gross measurement.
Domestic product is the value of all UK goods and services produced, including those produced for export. It does not include property income which flows into and out of the UK economy. Property income refers to income from various types of investment abroad, such as profits and dividends. When this is added, the measure becomes national product, called Gross National Product, GNP.
Growth can be measured as an annual percentage increase in real GDP, and in terms of a general trend. The trend rate of growth is the long term non-inflationary average rate of growth for an economy. In the UK it is around 2.5% per year.
Why is stable growth an economic objective?
If growth rises significantly above or below the trend rate, the economy is experiencing excessive growth or low growth. If the rate becomes negative for at least 2 quarters in succession, the economy is in recession.
The trade (growth) cycle
Changes in real national income tend to be cyclical, but it is desirable that this cycle is stable rather than unstable. Unstable growth is popularly called ‘boom’ and ‘bust’.
Although an economy’s growth is cyclical in nature, the underlying ‘trend’ can be derived from annual growth statistics. Trends can be calculated by using a technique called moving averages. The UK trend rate over the last 25 years is around 2.5%.
Excessive growth can lead to:
- Goods and service inflation
- House price inflation
- Wage inflation
- Labour shortages
- Falling savings
- Excessive credit
- Trade difficulties
Low or negative growth can lead to:
- Goods deflation
- House price deflation
- Labour surpluses
- Unemployment
- Excessive debt burden
- Public sector debt
Predicting turning points
Changes, or turning points, in the level of national income can be predicted and confirmed using economic indicators. Leading indicators typically monitor changes in interest rates, business confidence and new housing starts-ups – all of which provides clues to the next turning point in an economy’s growth cycle. Changes in these indicate that GDP is likely to change in 12 to 18 months time. The OECD’s main indicator, the Composite Leading Indicator (CLI), tracks deviations from the long-term trend, which provides an early warning system for policy makers.
A short leading indicator can be used to monitor changes in consumer credit and new car registrations. A lagging indicator monitors changes in unemployment and real investment and confirms that the turning point has occurred. All indicators help policy makers decide when to implement a policy and by what degree.
UK growth rates
UK growth rates can be expressed in an index or as annual percentages.
The advantages of growth
Economic growth is associated with a number of material benefits which increase economic welfare. These include the following:
Higher GDP per capita
A rise in real national income means that wages and profits are likely to rise. Assuming a stable population, this will raise GDP per capita.
More public and merit goods
A growing economy means that the public sector can receive more tax revenue and more resources can be allocated to public and merit goods, such as more roads, hospitals and schools.
Positive externalities
Public and merit goods generate considerable external benefits. More hospitals and schools mean a healthier and better-educated population, which generates other economic benefits in terms of the effectiveness of the labour force, and increases in long-term aggregate supply.
More employment
Growth is clearly likely to stimulate demand for labour, and it is likely that more people will be employed and fewer unemployed.
The disadvantages of growth
Economic growth also brings some costs which reduce economic welfare, including:
Negative externalities
As production and consumption increase, negative externalities, such as pollution and congestion, are likely to arise. There is also the likelihood of increased depletion of non-renewable resources, such as fossil fuels.
Inflation and balance of payments difficulties
Too rapid a rate of growth can also lead to two significant economic problems: inflationary pressure and a balance of payments deficit, as imports rise to satisfy an increasingly active household sector.
Widening income gap
Growth can also widen the distribution of income, because some groups may benefit much more than others. Certainly in the UK, the relative income gap has widened during the growth years of 1992 to 2008.
Limitations of using GDP per capita over time
There are several limitations of using GDP statistics for comparing changes in economic well-being over time, including:
Changes in the distribution of income
Average GDP per capita may rise over time, but the distribution of income may widen. For example, a rise in the mean average income per head can be misleading because the average may rise because just a few of the population increase their personal income. Indeed, the mean average can rise, but the median, the mid-point in a range of numbers, can fall.
Differences in hours worked
People may be working longer hours, in which case some of the growth may be through increased work, rather than through increased efficiency.
Unpaid work is not recorded
People may undertake unpaid work, and this may not be officially recorded.
Price changes
Prices are unlikely to remain constant over time, so GDP figures must be converted to at constant prices and measured from a base year. This process is called ‘indexing’ and is required to avoid the distorting effects of inflation.
Negative externalities
The quality of life may suffer as GDP increases, although this is not included in GDP statistics. For example, more driving raises GDP, but also adds to CO2 emissions, which can reduce the quality of life.
Changes in the quality of products
Over time the quality of products tends to increase, so a given amount of income per capita in 2010 may purchase a higher quality product than it did in 2000. This is certainly true with high-technology consumer products, like PCs, laptops and mobile phones.
Limitations of using GDP statistics for international comparisons
Limitations of using GDP statistics for international comparisons include:
Differences in the distribution of income
Although two countries may have similar GDP per capita figures, the distribution of income in each country may be very different.
Differences in hours worked
As when comparing a country over time, the number of hours worked to generate a given level of income may be quite different. For example, workers in the UK tend to work longer hours than those in France, and this would falsely inflate the GDP figures in the UK relative to France.
International price differences
International prices will also vary. This is significant because an individual’s purchasing power is based on price in relation to income. To solve this problem, GDP statistics can be re-calculated in terms of purchasing power. The purchasing power of a currency refers to the quantity of the currency needed to purchase a given unit of a good, or common basket of goods and services. Purchasing power is clearly determined by the relative cost of living and inflation rates in different countries. Achieving purchasing power parity means equalising the purchasing power of two currencies by taking into account cost of living and inflation differences.
For example, if we simply convert GDP in Japan to US dollars using market exchange rates, relative purchasing power is not taken into account, and the validity of the comparison is weakened. By adjusting rates to take into account local purchasing power differences, known as PPP adjusted exchange rates, international comparisons are more valid.
Difficulty of assessing true values
The true value of public goods and merit goods, such as defence, education and transport infrastructure is largely unknown. This means that it is difficult to compare two countries with very different levels of spending on these goods and assets.
The unofficial economy
Similarly, the existence of a large unofficial economy may make comparisons based on official GDP very misleading. For example, comparing the official GDP of the UK and Russia may be misleading because of the size of Russia’s unofficial economy. While all countries have unofficial economies, their size and significance can vary considerably.
Currency conversion
GDP figures for different countries must be converted to a common currency, such as the US dollar, and this may give misleading figures. For some countries, exchange rates against the US dollar may be unrepresentative of the true value of the currency, especially where international trade is relatively small. In such cases, converting to US dollars may significantly under-value national output. This explains why conversion to purchasing power parity is often preferred to conversion to US dollars.
Sustainable development and quality of life
In recognising that economic welfare is not simply about economic growth, in 1999 the UK government introduced a policy for sustainable development, and refined this further in 2005.
Sustainable development is considered in four main categories using 20 main indicators, and 68 indicators in total. The categories are:
- Sustainable consumption and production
- Climate change and energy
- Natural resource protection and enhancing the environment
- Creating sustainable communities and a fairer world