
Equity and inequality
Equity and inequality
Equity means fairness or evenness, and achieving it is considered to be an economic objective. Despite the general recognition of the desirability of fairness, it is often regarded as too normative a concept given that it is difficult to define and measure. However, for most economists, equity relates to how fairly income and opportunity are distributed between different groups in society.
The opposite of equity is inequality, and this can arise in two main ways:
Inequality of outcome
Inequality of outcome from economic transactions occurs when some individuals gain much more than others from an economic transaction. For example, individuals who sell their labour to a single buyer, a monopsonist, may receive a much lower wage than those who sell their labour to a firm in a very competitive market. Differences in income are an important type of inequality of outcome.
Inequality of opportunity
Inequality of opportunity occurs when individuals are denied access to institutions or employment, which limits their ability to benefit from living in a market economy. For example, children from poor homes may be denied access to high quality education, which limits their ability to achieve high levels of income in the future.
Does inequality serve a purpose?
Market economies rely on the price mechanism to allocate resources. This means that economic resources are allocated prices which reflect demand and supply, which operate via incentives. For example, rising wages act as an incentive to labour to become more employable, and provide a reward for those that do. Inequality, therefore, acts as an incentive to improve and specialise in producing those goods, services, and resources that command the highest reward.
However, critics of unregulated market economies raise doubts about the need for such vast differences in income that exist in the UK, and many other economies, and that significantly smaller differences would create a sufficient incentive to reward effort, ability, and wealth creation. For example, an average wage of £5,000 per week for a professional footballer would be more than sufficient to encourage gifted young footballers to want to become a professional player. This compares with wages of over £100,000 per week for the best players.
Measuring inequality of income
The two main methods for measuring inequality are the Lorenz curve and the Gini index.
The Lorenz curve
A Lorenz curve shows the % of income earned by a given % of the population.
A ‘perfect’ income distribution would be one where each % received the same % of income.
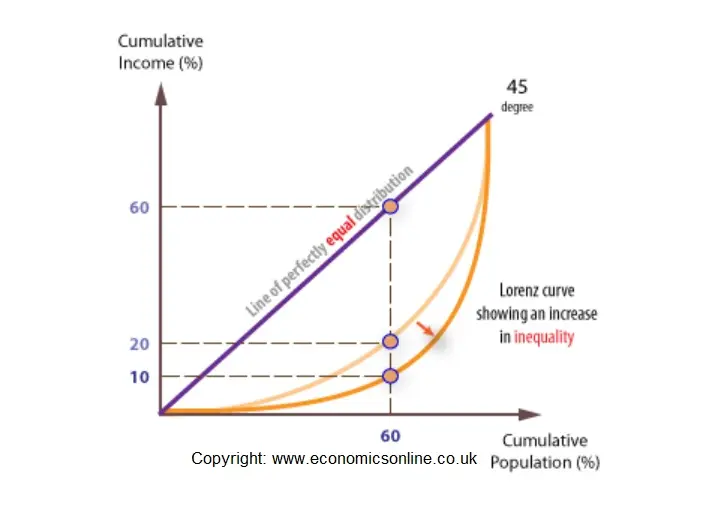
Perfect equality would be, for example, where 60% of the population gain 60% of national income. In the above Lorenz curve, 60% of the population gain only 20% of the income, hence the curve diverges from the line of perfect equality of income.
The further the Lorenz curve is from the 45 degree line, the less equal is the distribution of income.
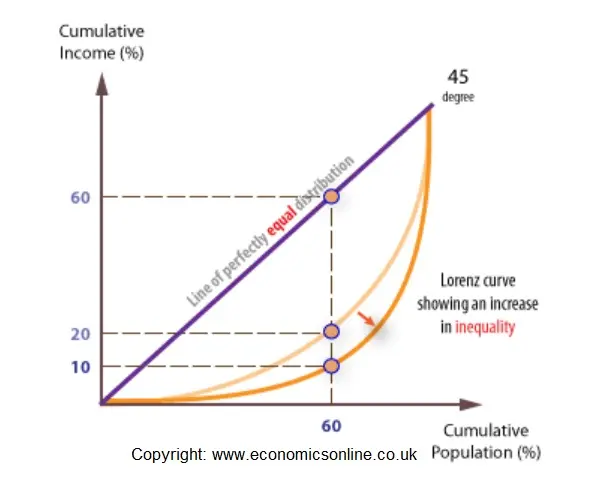
Changes in the position of the Lorenze curve indicates changes in the distribution of income. In this example, the curve for 2010 is further away from the line of equal distribution than the curve in 1990, implying a wider distribution of income.
The Gini co-efficient and index
The Gini co-efficient or index is a mathematical device used to compare income distributions over time and between economies. The Gini co-efficient can be used in conjunction with the Lorenz curve. It is calculated by comparing the area under the Lorenz curve and the area from the 450 line to the right hand and ‘x’ axis. In terms of the Gini index, the closer the number is to 100 the greater the degree of inequality.
The Gini co-efficient can be applied to income inequality in several ways, including differences in original income, gross income (which adds cash benefits and deducts direct taxes) and disposable income (gross income less spending on indirect taxes). Inequality steadily increased between 1980 and 2000 – from 28.6 to 36.2 – the double dip recession had a greater impact on middle and higher income levels, and the index fell from 34.3 to 32.6 between 2009 and 2015.
See also: Gini index
The S80-S20 ratio
The S80-S20 ratio is an alternative indicator of inequality, and is the ratio of the total (equivalised*) disposable income of the richest 20% of the population to the income of the poorest 20%. The higher the ratio, the higher the level of income inequality. Using this measure, income inequality has fallen between 2007 and 2015.
* Equivalised income is income adjusted to take into account the number of people living in a household and their ages.
Equity and efficiency
When markets are free from imperfections, such as information failure and externalities, resources will be allocated in such a way that efficiency will be achieved. In attempting to achieve equity, governments may intervene and distort the workings of the market so that while equity is gained, efficiency is lost. For example, welfare payments help narrow the gap between rich and poor, but they may create moral hazard and produce a disincentive effect, so that welfare recipients remain dependent on welfare payments into the long run. This is known as the equity-efficiency trade-off.
Causes of inequality of income
There are several possible reasons for the widening gap between rich and poor in the UK, including:
- The increased labour market participation of married females, greatly adding to the incomes of married-couple households.
- Single parents, who constitute a large share of the lowest quintile, have done proportionately badly as benefits have not kept pace with earnings – benefits are linked to inflation, not to average earnings.
- The same is true for the increasing numbers of low paid pensioners.
- The wages of skilled workers have risen in comparison with unskilled.
- Trade union power has been eroded which, along with the abolition of Wage Councils in 1993, has meant that protection for low paid has decreased.
- The rise of the ‘unofficial labour market’ means that there appears to be a growing number of low paid immigrant workers, who work for cash and are paid much less than the national minimum wage.
- A reduction in the level of progressiveness of the tax and benefits system, which occurred from the early 1980s. Prior to this, top marginal tax rates had a considerable re-distributive effect.
- A rise of share ownership, and increasingly profitable performance of the stock market, which has increased incomes for shareholders.
- Given that the general trend is for house prices and shares prices to be greater than the general price level, owners of property and financial assets, such as shares, have generally done much better than non-owners. Rising house and share prices have increased personal wealth which can be translated into spending via equity withdrawal.
- A rapid increase in executive pay, often referred to as elite compensation. However, it can be argued that high pay levels are necessary to avoid a Lemons Problem. Those subscribing to this view argue that unless executive pay rates are set above the market rate, the recruitment process would be clogged-up with poor quality applicants.
- An increasingly flexible labour market, with more workers being employed part-time, as opposed to full time, would help increase income inequalities.
See also: Inequality of wealth
Polices to reduce inequality and poverty